The Analytics page is the main page of the Dashboard, allowing users to access real-time data on their community and the actions taken to actively protect it.

In order to show you everything, we will take a look at the parameters allowing you to display information, and then dive into the four sections on the page:
For each chart detailed in this article, the option button ![]() allows you to export the data in different formats: CSV and PDF documents or PNG and JPG images.
allows you to export the data in different formats: CSV and PDF documents or PNG and JPG images.
1. Introducing the Analytics page
Before getting deeper into data, there are two parameters to choose what information you need to display:
Time range Our date picker allows flexibility and precision. You can select from preset date ranges, as well as custom picks using:
- Between: pick two dates to retrieve stats from the start date to the end one.
- Last: select a volume and a temporality (hour, day, week, month...) and choose to include the current period or not.
- After: pick an exact date and retrieve stats from that precise time to now.
- Before: pick an exact date and retrieve stats until that precise time.
- Period to date: choose a time frame (day, week, month, quarter...) to retrieve stats on the range to now.
Source selection
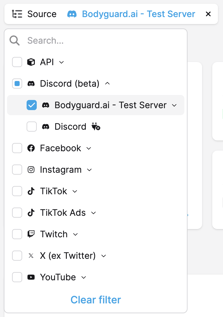
By default, data from all sources are displayed.
By clicking on 'source' you will get the list of all sources connected, displayed by source type (social media platform).
You can select source types or sources you want to monitor, combine them, and 'clear filters' to go back to default setting.
2. Analytics overview
The overview section provides a high level analysis of the comments you have received in the time range selected.
The info it provides:
- All messages: total amount of comments received during the time range selected, with a graph of the evolution over time and a mention of the evolution versus the last period.
- Removed: total amount of messages removed, with the ratio of removed messages, and the evolution vs the last period.
- Kept: total amount of messages kept, with the ratio of kept messages, and the evolution vs the last period.
- Message distribution: total amount of messages received sorted by category - Positive, Criticism, Neutral, Hate Speech, Hateful, Undesirable.
- Industry average: when this box is checked, you get the average ratio of your industry for each content category, to compare with other companies from your line of business.
The 'vs last period' refers to the same previous time range, meaning the day before if you selected 'today', the 7 days before if you selected the week range.
3. Moderation
The moderation section allows you to deep dive into moderation statistics. To have an extended version with detailed charts and graphs on classifications, click on 'see all moderation analytics'.

This section provides four charts detailing:
- Message distribution over time: evolution of the total amount of messages over the time period selected, with filters by content category.
- Message distribution by source: total amount of messages distributed by source, with category filters.
- Action on messages by category: distribution of kept messages, automatically removed messages and manually removed messages by category.
- Action on messages by source: distribution of kept messages, automatically removed messages and manually removed messages by source.
4. Community
The community section allows you to deep dive into audience insights. To have an extended version with detailed charts, click on 'see all community analytics'.

This section provides four charts detailing:
- Authors evolution over time: total amount of authors distributed by type (new author: has posted their first message in the selected period, returning author: has posted a message in the selected period), with the evolution over the time range selected.
- Message distribution by language: total amount of messages distributed by language, with a filter on moderated languages (subscribed or included in your plan) and non-moderated (disabled).
- Top 5 most followed sources: ranking of your most followed sources (account, channel) or source types (social media) with the evolution vs the last period.
- Top 5 most toxic authors: ranking of your most toxic authors with their amount of messages, the toxicity ratio (hateful + hate speech messages) and their status.
The 'vs last period' refers to the same previous time range, meaning the day before if you selected 'today', the 7 days before if you selected the week range.
5. Engagement
The engagement section allows you to deep dive into the performance data of your posts.
 This section provides two charts detailing:
- Bad buzz: ranking of your posts that generated the most toxic reactions, with the number of messages and the toxicity ratio (hateful + hate speech comments).
- Good vibes: ranking of your posts that generated the most positive reactions, with the number of messages and the positivity ratio .